United, American and Delta All Slide as Airline Trade Splits
All three legacy carriers traded lower on Aug. 20, 2026, with United down 3.53%, Delta down 2.65% and American down 2.38% — each falling further than the broad market on a red day.
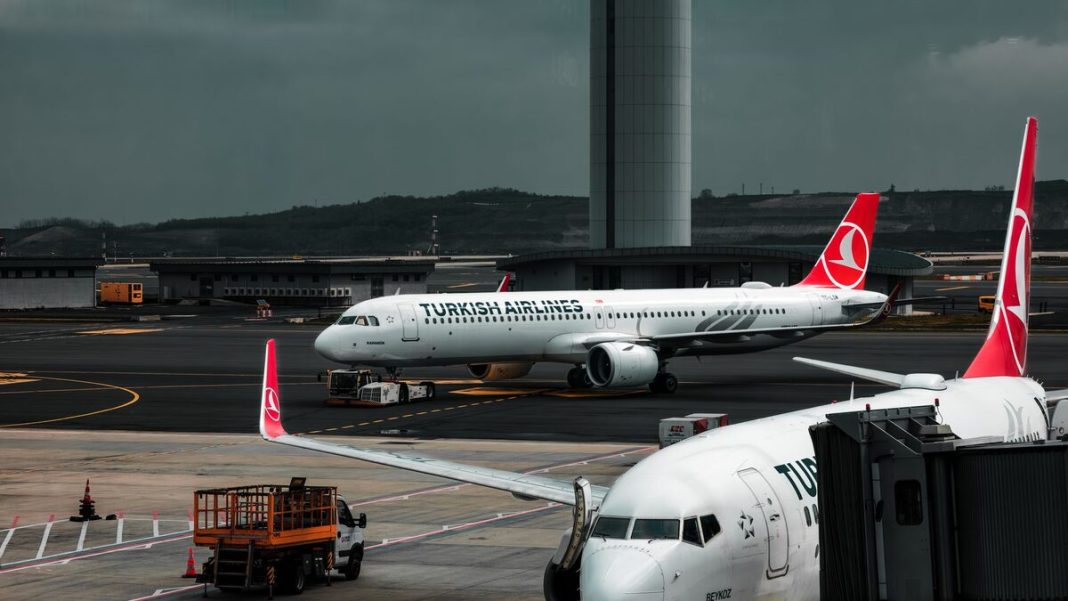
United Airlines fell 3.53% to 111.69, Delta Air Lines fell 2.65% to 81.08 and American Airlines fell 2.38% to 13.53 in intraday trade on Aug. 20, 2026, each dropping more than the S&P 500's 0.86% decline, as 24/7 Wall St. framed the year's divergence among the three carriers as a question of cost structure.
The three big U.S. legacy carriers went down together on Thursday, but not by the same amount, and the gaps between them are the whole story of the 2026 airline trade.
As of the last trade at 19:57 GMT on Aug. 20, 2026, United Airlines Holdings (UAL) was quoted at 111.69, down 3.53% from a previous close of 115.78, with an intraday range of 110.95 to 114.18. Delta Air Lines (DAL) changed hands at 81.08, off 2.65% from 83.29, having traded between 80.67 and 82.66. American Airlines Group (AAL) sat at 13.53, down 2.38% from 13.86, in a range of 13.43 to 13.73.
All three were closing the session near the bottom of their daily ranges — a pattern that usually says sellers, not buyers, controlled the last hour.
A red tape across the market, but airlines took more of it
Thursday was not an airline-specific event. The S&P 500 proxy (SPY) was at $762.43, down 0.86%; the Nasdaq 100 proxy (QQQ) at $710.80, down 0.74%; and the Dow 30 proxy (DIA) at $527.50, down 1.27%, the weakest of the three benchmarks. Every major index was in the red and every index was trading at or very near its intraday low.
What separates the carriers from the tape is magnitude. United's 3.53% decline was roughly 2.67 percentage points steeper than the S&P proxy's, Delta's about 1.79 points steeper and American's about 1.52 points steeper — an illustrative comparison based on the same-session moves above. That is the classic high-beta behavior of airline equities: when the market catches a cold, carriers run a fever, because their earnings sit downstream of fuel costs, interest rates and discretionary travel budgets all at once.
Worth noting for anyone reading the percentages alone: American's 2.38% drop was the smallest of the three in percentage terms, but on a 13.86 prior close that is a move of just 0.33 in price. Low-priced equities move in bigger percentage steps for the same absolute change, which flatters — or punishes — them on any single day's screen.
The structural argument behind the 2026 divergence
The framing that prompted this comparison came from 24/7 Wall St., which argued that the three carriers flew the same turbulent 2026 skies and yet their share prices landed in very different places — and that the split traces back to one structural advantage that only one of them had built into its business model before fuel prices started climbing.
That is the right lens even without agreeing on which carrier holds the advantage. Airline profitability is a spread business: the gap between what a seat sells for and what it costs to fly. When jet fuel rises, the cost side moves for everyone in the same direction on roughly the same day. What differs is how much protection each carrier built beforehand — through hedging policy, through fleet age and fuel burn, through balance-sheet capacity to absorb a bad quarter, and above all through revenue mix.
Revenue mix is where the legacy carriers have separated most visibly this decade. Premium cabins, corporate contracts, loyalty-program economics and co-branded credit card agreements generate income that does not scale one-for-one with the price of a coach seat. A carrier that has shifted a larger share of its revenue toward those streams keeps more of the fare when fuel spikes, because the customers paying those fares are the least price-sensitive on the aircraft. A carrier still dependent on the marginal leisure passenger has to choose between raising fares into weak demand or eating the cost.
What the price levels themselves imply
Share prices are not valuations, and the three tickers are not comparable on price alone — a share count is required for that, and none of these figures speak to it. But the price levels do tell you something about how the market has treated each name over time. A stock trading at 111.69 and a stock trading at 13.53 have very different investor bases, different index weightings and different sensitivity to the kind of index-level selling that hit on Thursday.
Low-priced airline equities in particular attract flow that is not fundamentally driven, which is one reason American's daily percentage move can look calmer than United's on a session when nothing carrier-specific happened. Reading a single day's moves as evidence of who is winning 2026 would be a mistake in either direction.
What to watch from here
Share prices are not valuations, and the three tickers are not comparable on price alone — a share count is required for that, and none of these figures speak to it.
A few markers will settle the argument better than any one session:
- Unit revenue trends. Revenue per available seat mile, and how much of it comes from premium cabins versus main cabin, is the cleanest read on whether a carrier's mix advantage is real.
- Cost per available seat mile excluding fuel. This strips out the input every carrier shares and shows who actually runs a leaner operation.
- Hedging disclosure. Whether and how far forward each airline locked in fuel before prices moved determines how much of a rise flows straight to the income statement.
- Loyalty and card economics. Co-brand agreements have become a large, steady earnings stream for the carriers that built them out, and they are largely insulated from fuel.
- Capacity discipline. If carriers keep adding seats into a softening demand backdrop, fares fall and the fuel problem compounds.
The broader macro backdrop is not helping. With the Dow proxy down 1.27% on the day and both the S&P and Nasdaq proxies pinned near session lows, the market was in a risk-reducing mood, and cyclicals with heavy fixed costs and heavy debt loads are the first place that shows up. Airlines carry both.
The comparison that actually matters
For investors deciding among the three, the useful question is not which stock fell least on a single afternoon in August. It is which carrier's earnings hold up if fuel stays elevated and discretionary travel demand softens at the same time — the combination that has historically separated airline winners from airline casualties.
On that test, the structural argument outranks the daily tape. A carrier with a premium-weighted revenue base, a young and efficient fleet, and a loyalty franchise throwing off cash independent of seat prices can absorb a fuel shock that would force a more commoditized competitor into fare cuts or capacity retreats. The gap between the three carriers' 2026 share performance is the market pricing exactly that difference — and Thursday's synchronized decline, for all its uniformity, does nothing to close it.
Frequently asked questions
How did United, American and Delta trade on Aug. 20, 2026?
All three fell. As of the last trade at 19:57 GMT, United Airlines Holdings was at 111.69, down 3.53% from a prior close of 115.78. Delta Air Lines was at 81.08, down 2.65% from 83.29. American Airlines Group was at 13.53, down 2.38% from 13.86. Each finished near the low end of its intraday range.
Did the airlines fall more than the wider market?
Yes. The S&P 500 proxy SPY was down 0.86% at $762.43, the Nasdaq 100 proxy QQQ down 0.74% at $710.80 and the Dow proxy DIA down 1.27% at $527.50. All three carriers declined by more than any of those benchmarks, consistent with the high-beta behavior airline equities typically show on risk-off sessions.
What is the structural advantage the 2026 divergence is attributed to?
24/7 Wall St. argued that the three carriers' 2026 share performance split because only one built a particular structural advantage into its business model before fuel prices began climbing. Structurally, that generally means revenue mix — premium cabins, corporate contracts and loyalty and co-brand card income that does not move one-for-one with coach fares.
Why did American fall the least in percentage terms?
American's 2.38% decline came off a previous close of 13.86, so the price move was small in absolute terms. Low-priced shares register larger percentage swings for the same dollar move, which cuts both ways. A single session's percentage comparison across three very differently priced stocks tells you little about relative business strength.
Can you compare these three airlines on share price alone?
No. Share price reflects share count as much as company value, so a stock at 111.69 is not inherently more expensive than one at 13.53. Meaningful comparison requires market capitalization, earnings, debt and unit economics such as revenue and cost per available seat mile, none of which are captured by a quoted price.
What metrics decide which airline outperforms if fuel stays high?
Four matter most: unit revenue and the share of it coming from premium cabins; cost per available seat mile excluding fuel, which shows operating efficiency; forward fuel hedging, which determines how much of a price rise hits earnings immediately; and loyalty and co-brand card economics, which generate cash largely insulated from seat prices.
Sources
Photo: Hobi Photography · Pexels Licence — source