Why Market Breadth Is the Most Underrated Gauge of Where Stocks Are Really Headed
There is a quiet conversation happening beneath the surface of every market rally and every downturn, one that most retail investors never tune into. While headlines chase index levels and earnings beats…
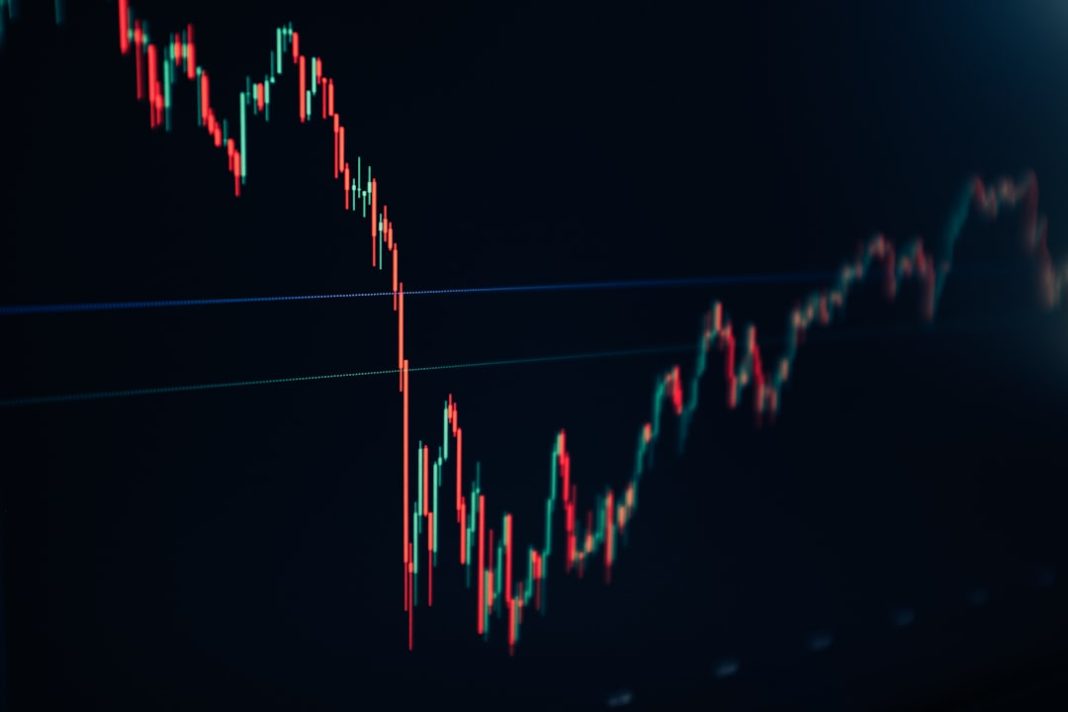
There is a quiet conversation happening beneath the surface of every market rally and every downturn, one that most retail investors never tune into. While headlines chase index levels and earnings beats, seasoned portfolio managers are watching something far more revealing: market breadth. And right now, what the market breadth indicator is showing deserves serious attention from anyone with money on the line.
Market breadth measures the degree to which a broad move in the market is supported—or undermined—by participation across individual stocks. Think of it this way: if the S&P 500 climbs 1.5% on a given day but only 200 of its 500 components are advancing while 300 are falling, that rally is telling a very different story than one where 400 stocks are rising. The index can mask enormous internal weakness, and that weakness is precisely what the market breadth indicator is designed to expose.
The most commonly used breadth tools include the Advance-Decline Line, the McClellan Oscillator, the percentage of stocks trading above their 200-day moving averages, and the New Highs vs. New Lows ratio. Each of these approaches the same fundamental question from a different angle: is this market’s strength broad-based, or is it being manufactured by a handful of mega-cap names dragging the index upward while the rest of the market quietly deteriorates? Historically, divergences between index performance and market breadth data have preceded some of the most notable market corrections of the past several decades—including the tech-led narrowing seen ahead of major reversals.
What makes the market breadth indicator so powerful is that it functions as an early warning system. When breadth diverges negatively from price—meaning the index is pushing to new highs while fewer and fewer stocks participate—it often signals that the rally is running on fumes. Institutional money begins rotating out, hedges go on, and the large-cap names carrying the index eventually succumb to the broader pressure. Conversely, a breadth thrust, where a massive percentage of stocks advance in a compressed timeframe, is one of the most statistically reliable signals of a durable bull market leg. These thrusts have historically preceded strong 12-month returns with remarkable consistency.
For retail investors, the practical implication is significant. If you are allocating to index funds or ETFs under the assumption that index performance reflects overall market health, the market breadth indicator can save you from a dangerous misreading. A narrow market is a fragile market. When the top five or ten stocks are doing the heavy lifting, the risk concentration is far higher than the index level suggests. Monitoring breadth gives you context that the price chart alone simply cannot provide.
Institutional investors have their own reasons to care deeply. Portfolio managers benchmarked against the S&P 500 face a particularly tricky dynamic when breadth narrows. Underweighting the mega-caps that are driving performance creates tracking error, but overweighting them concentrates risk in names that are already extended. Breadth data helps these professionals calibrate exposure, time sector rotations, and defend against drawdowns before they metastasize into portfolio-damaging events. Some quant shops have integrated breadth metrics directly into their factor models, treating participation data as a risk overlay that adjusts position sizing in real time.
What makes the market breadth indicator so powerful is that it functions as an early warning system.
The McClellan Oscillator deserves special mention for investors who want a more dynamic, shorter-term read. It measures the difference between a 19-day and 39-day exponential moving average of net advances, effectively capturing the momentum of breadth rather than just its current level. When the oscillator swings to extreme negative territory and then reverses sharply, it has historically identified durable buying opportunities. When it reaches extreme positive readings without a corresponding move to fresh index highs, the warning flags go up. It is not a crystal ball, but used alongside other breadth tools and technical analysis, it sharpens the picture considerably.
Key takeaways for investors navigating current conditions: First, never evaluate an index move in isolation—always cross-reference it with breadth data to assess whether the move has genuine staying power. Second, a sustained divergence between rising index prices and deteriorating breadth is a risk management signal, not a buy signal. Third, breadth thrusts—particularly when more than 90% of stocks advance over a short window—are historically among the strongest forward-looking indicators of continued gains and should not be faded. Fourth, sector-level breadth analysis can identify where institutional money is rotating before that rotation becomes obvious in price action, giving attentive investors a meaningful edge.
Markets will always generate noise, and narratives will always compete for investor attention. But the market breadth indicator cuts through the noise with data that is difficult to spin and impossible to fake. As equity markets continue navigating a complex macro landscape of rate sensitivity, earnings divergence, and shifting sector leadership, investors who understand what breadth is telling them will be better positioned to act with conviction—not just react with emotion. The stocks that are showing up, and the ones quietly slipping away, are telling a story. The question is whether you are listening.