


.1570736070337")
Stocks have had some violent swings in both directions this year, but they keep coming back to the same place —and that may be setting up for longer term gains.
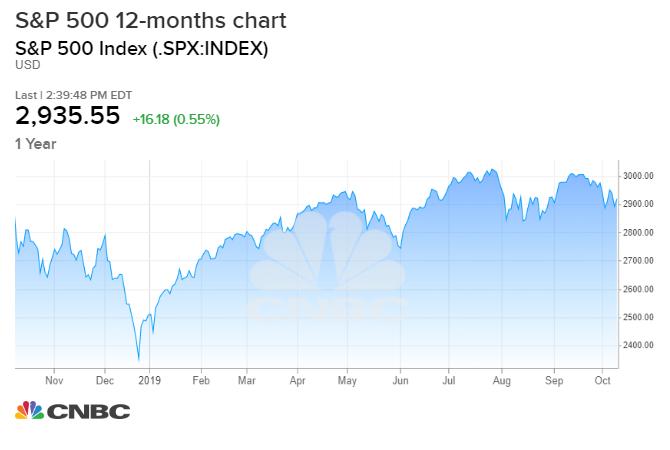
At roughly 2,935-2,940, the S&P 500 is revisiting a chart point it’s been at a number of times this year, and also going back to last year.
“That’s a level the market has oscillated around for the better part of the last six months. It initially market the peak from last September, 2018. It seems to be an important level. It marked resistance in May. We broke through it in July, and since then it oscillated above and below. We’re back below it in October,” said Ari Wald, technical analyst at Oppenheimer.
But Wald said the market’s focus on that level is by no means negative. “Following an extended period of little market progress, the thinking is that forward returns should be stronger…We’re bullish on the market,” he said.
Wald expects the S&P 500 to reach 3,100 this year, and says it could reach 3,500 next year.
The fundamental catalyst could be some sort off trade deal with China. Stocks were set to jump on Friday with President Donald Trump meeting China Vice Premier Liu He later in the day. The two are expected to come up with some sort of “mini” deal that would delay tariff increases.
Bespoke studied this range bound phenomena, and found that longer term, after a period of range trading, the market gains in line with its historical averages most of the time, but in the near term, it tends to lag.
As of the close Monday, the S&P 500 at 2,938, was within 2% of the level it closed at exactly one month ago, three months ago, six months ago and one year ago.
Since 1929, there have only been 43 instances that fit the same criteria, and they were clustered into eight separate periods. In the first month after those eight periods, the market was higher by 0.9% on average, but in six months, the S&P averaged a decline of 1.3%.
But over the next six to 12 months, stocks bounced back. After six months, the S&P median return was an average gain of 3.4%, and the S&P was higher 75% of the time. That is a bit below the average gain of 3.9% for all periods since 1929.
A year later, the S&P 500 was up 75% of the time, for a median gain of 7.9%, also slightly weaker than the historical average.
Paul Hickey, co-founder of Bespoke, said the headlines on trade wars and tariffs have been one factor holding the market within a range. As third quarter earnings season gets underway, Hickey said the last two earnings periods started out positive for the market, but then mid way through, trade war news disrupted the gains.
“Basically when we hit the high end of the range, we get negative headlines, and when we hit the low end, we get positive headlines,” said Hickey. “Back in April…and July, we got back to the high end of the range..and then reversed on trade and tariff tweets.”
Earnings season begins next week, with a handful of major banks, like J.P. Morgan, Wells Fargo and Citigroup, releasing reports Tuesday. Hickey said it could be a positive time for stocks, since analysts may have set the bar low on earnings expectations. According to Refinitiv, earnings for the S&P are expected to decline by 3.1%.
Wald said even though the market continues to pivot around 2,940, stocks are actually trading in line with a traditional seasonal history, setting a high in July and another in September. Then by mid October, which is coming up, there is often an inflection point.
“How we see it, it’s really just part of the space building process. It’s shaking out some of the weaker hands,” Wald said. “We’re stuck between expecting this new bull market confirmation and not yet seeing it. You still need to see some better action in small caps. On the flip side, there’s nothing to deter us that we can’t get it.”
Wald said he would like to see 60 to 70% of stocks above their 200-day moving average. Currently just about 43% are at that level, he said.
He said the market is acting the way it normally does after coming out of a bear correction, which he said the market experienced last December. Nine months off a low, the market is typically up 28%, and nine months after the Dec. 24 bottom, the S&P was up about 27%.
“The market is showing resilience in what has been a lot of bad news coming out,” he said, noting that the ISM data has shown two months of contraction in manufacturing.


