


The stock market’s September pullback was likely the first of many as it follows a “stair-step” playbook that echoes the rally off the financial-crisis low in 2009, one prominent Wall Street bull argued in a Monday note.
“The 7% correction in the S&P 500 SPX, +1.27% over the past six trading sessions is likely the first of a few 3-7% drawdowns followed by new highs as the market stair-steps higher like the fall of 2009, driven by election-year angst and the extended nature of the market-cap-weighted indices,” said Tony Dwyer, chief market strategist at Canaccord Genuity.
After the S&P 500 and tech-heavy Nasdaq Composite COMP, +1.87% hit another round of record highs in early September, building on a huge August rally, stocks turned south as investors suddenly dumped the highest-flying, megacap growth stocks that had increasingly accounted for equity gains.
The Nasdaq early last week entered correction territory, falling more than 10% from a record high in just three trading sessions. The index’s 4.5% weekly decline was its largest since March. The S&P 500 ended Friday with a weekly loss of more than 2%, leaving it down 6.7% from its Sept. 2 record close. The Dow Jones Industrial Average DJIA, +1.18% fell 1.7% last week. All three major indexes gained ground Monday.
A pullback by extended “megacap” names in favor of “economic recovery” stocks that would benefit from putting the pandemic in the rear-view mirror had been expected, Dwyer said, pointing to an August note on the theme.
The election outlook is complicated not only by uncertainty over who will win the White House or which party will control the House and Senate, but also by possible controversy around the voting process itself and the question of whether either party will concede defeat “anywhere near election day.”
The Federal Reserve, in contrast, is more predictable, with uncertainty centered not on whether it will continue to support the economy, but what tools it will use to do so, he said.
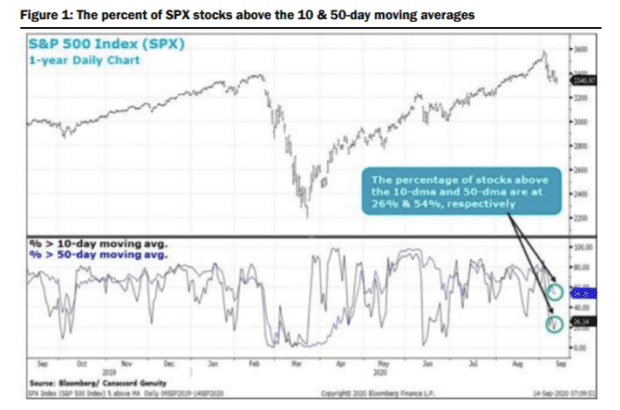
Meanwhile, the 7% pullback by the S&P 500 and the nearly 11% fall by the Nasdaq helped pull back some key tactical indicators from extreme territory, Dwyer said, noting that the proportion of S&P 500 stocks above their 10- and 50-day moving averages had pulled back to 26% and 54%, respectively (see chart below).
The Cboe Volatility Index VIX, -3.79%, which had spiked above 38 in early September, remains elevated but is now trading near 26, he noted, while the 14-week stochastic indicator for S&P 500 futures pulled back to 68 from a historically overbought reading of 98. Also, the Investors Intelligence reading on investment newsletter writers remains elevated at 59% but down from a reading of more than 60% — a lagging indicator, it’s likely to continue to fall in the near term even with a bounce by equites, Dwyer said.


