Stock Markets

The S&P 500 advanced for the fourth straight week, with technology stocks leading the index to a new record high. Economic data and corporate profits released last week showed that the recovery is progressing, yet it remains uneven. Existing-home sales rose by the most on record in July, boosted by low mortgage rates and low inventory. A few big-box retailers that reported second-quarter results saw profits surge during the pandemic. While these are clear pockets of strength supporting the economy and the market, unemployment remains elevated, highlighting the need for another fiscal package. Analysts contend that an appropriate balance and diversification can help prepare portfolios for any uptick in market volatility while also positioning them for the longer-term recovery.
US Economy
This week the S&P 500 edged passed its pre-pandemic record high reached in February. It was a milestone that marks the roundtrip rally from lows to highs as the fastest bear-market plunge and the second-fastest bear-market recovery in U.S. history. In contrast, the economy has not had a chance to recover as swiftly from the plunge in economic activity in the second quarter as a result of the pandemic and the national and global lockdown measures to contain it. The good news is that after the greatest decline in economic activity since the Great Depression in the second quarter the economy has shown signs of recovery. The bad news is that with COVID-19 cases still at elevated levels, the momentum of that rebound has softened in August.
Metals and Mining
Gold was holding around US$1,930 per ounce on Friday, set to record a second week of declines since breaching the crucial US$2,000 mark. A strong US dollar is pulling the yellow metal back as economic recovery concerns provide tailwinds. The other precious metals also faced pressure this session, but the base metals performed confidently amid positive manufacturing and consumer data. Starting the week at US$1,957, the gold price climbed above US$2,010 on Wednesday. The gain was short-lived, however, as it fell later that day to US$1,927.90. Despite the volatility this session, gold is still on track for a record-setting year. The yellow metal is up 24 percent year-to-date, and gold exchange-traded funds have also registered solid gains in 2020. July marked the eighth straight month of positive inflows — 166 tonnes were added over the month, pushing global holdings to 3,758 tonnes. Although gold is especially attractive in times of uncertainty, the yellow metal has always been the premier long-term investment. Silver’s push towards US$30 per ounce continued this week, with the metal touching US$28.27 on Tuesday. Headwinds mid-session prevented silver from holding its ground, pushing it back below US$27 by the end of the week. Like gold, silver has been on the decline for the last two weeks but is still maintaining broader gains made since January. Year-to-date, the dual metal has added 47 percent to its value. Platinum posted the steepest decline in the precious metals space this week, falling 5 percent since Monday. Decreased jewelry sales resulting from COVID-19, paired with weakened automotive demand, are the primary catalyst behind the decline. The metal’s price has returned to its pre-pandemic range but is still off its year-to-date high of US$1,022 per ounce, set on January 17. After a challenging June and July, the palladium price is holding above US$2,000 an ounce. Since falling to US$1,522 in March, palladium has been unable to maintain the US$2,200 level, although a brief surge at the end of July pushed the automotive metal to US$2,242. Since then, persistent supply chain disruptions and depressed vehicle demand have pulled the metal back to the US$2,000 range.
The copper price spiked early in the week, climbing from US$6,342.50 per tonne to US$6,667. The red metal was unable to maintain the new year-to-date high, pulling back a day later. Zinc made a minor gain this week, edging up from its Monday value of US$2,403 per tonne. Well above its mid-March level of US$1,773, zinc set a year-to-date high this session at US2,466.50. Despite the move, analysts have pointed out that US$2,500 is the resistance level for the metal, and it is currently trading below that. Zinc was selling for US$2,466.50 early on Friday. Nickel also registered a year-to-date high this week, topping US$14,700 per tonne. Unable to maintain the high, its price settled back to US$14,666 on Thursday, and it remained there on Friday. The lead sector also posted an uptick. By mid-week, lead was up 1.94 percent from Monday to US$1,994 per tonne. The move brought the metal closer to its price high for the year, US$2,026 in January. Some of those gains were shed later, and by Thursday lead was back to the US$1,964 range and holding.
Energy and Oil
Oil retreated at the end of the week on more negative news from the U.S. labor market. Oil prices fell back to a familiar trading range in the low-$40s. “With all the bullish headlines that we’ve seen over the last weeks regarding inventories,” the inability to break higher does not bode well, Tariq Zahir, managing member of the global macro program at Tyche Capital Advisors LLC, told the media. “Crude fails to break to the upside and you’re in a contango market, so risk is to the downside.” U.S. oil inventories declined again last week, the fifth time in six weeks. But the process will take a while. OPEC warned that the drawdowns are “slower than anticipated with growing risks of a prolonged wave of COVID-19.” The slow pace underscores the “fragility of the market.” The group of OPEC+ producers that may need to compensate for past overproduction could cut by as much as 2.31 mb/d for one month, according to OPEC+ calculations seen by Reuters. If spread over more than one month, the figure would be smaller. Natural gas spot price movements were mixed this week. The Henry Hub spot price rose from $2.06 per million British thermal units (MMBtu) last week to $2.36/MMBtu this week. At the New York Mercantile Exchange (Nymex), the price of the September 2020 contract increased 27¢, from $2.152/MMBtu last week to $2.426/MMBtu this week. The price of the 12-month strip averaging September 2020 through August 2021 futures contracts climbed 15¢/MMBtu to $2.866/MMBtu.
World Markets
European shares weakened on worsening U.S.-China relations and growing concerns that a resurgence in coronavirus infections could derail an economic recovery. In local currency terms, the pan-European STOXX Europe 600 Index ended the week 0.81% lower, while Germany’s Xetra DAX Index fell 1.06%, France’s CAC 40 slipped 1.34%, and Italy’s FTSE MIB declined 1.66%. The UK’s FTSE 100 Index shed 1.45%.
The net long position in euro futures climbed to a record level of more than USD 30 billion in the week ended August 11, according to the U.S. Commodity Futures Trading Commission. During the week, the euro reached its highest value relative to the dollar since May 2018, partly on the view that the eurozone economy would recover faster from coronavirus lockdowns than the U.S.
Mainland Chinese stocks ended the week slightly higher as President Donald Trump’s postponement of a six-month trade review assuaged concerns about deteriorating U.S.-China ties. Some observers believe that the White House is seeking more time to allow China to increase purchases of U.S. farm and other exports in order to burnish the optics of the trade deal. However, tensions remained on low boil as the U.S. announced more restrictions on Huawei Technologies, making it difficult for the Chinese telecoms giant to maintain production beyond September without a supply of advanced chips from the U.S. or Taiwan. Longer term, the Trump administration’s actions to restrict the access of Chinese companies to U.S. semiconductor technology will likely remain a source of tension with the U.S. and spur Beijing to foster its domestic technology capabilities.
The Week Ahead
Economic data being released include consumer confidence on Tuesday, durable goods on Wednesday, and personal income and spending on Friday.
Key Topics to Watch
- Chicago Fed national activity index
- Case-Shiller national home price index
- Consumer confidence index
- New home sales (SAAR)
- Durable goods orders July
- Core capital goods orders
- Initial jobless claims
- Initial jobless claims (total, NSA)
- Continuing jobless claims (state program, SA)
- Continuing jobless claims (total, NSA)
- GDP revision (SAAR)
- Pending home sales index
- Personal income
- Consumer spending
- Core inflation July
- Advance trade in goods
- Chicago PMI
- Consumer sentiment index (final)
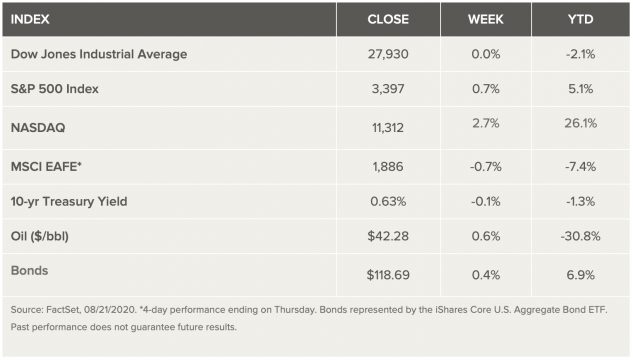
Markets Index Wrap Up