Stock Markets
Following another weekly gain, and almost five months after the bear-market low in March, the S&P 500 closed within striking distance of its record high. Even though the pace of improvement is slowing, economic data continue to show steady progress. Initial jobless claims fell below one million for the first time since March, and U.S. retail sales continued to rebound in July, exceeding pre-pandemic levels. As a result of better-than-expected data and an uptick in inflation, government-bond yields hit a two-month high. The lack of progress in the negotiations for another round of fiscal aid represents a growing short-term risk, but fundamentals remain reasonably supportive, according to analysts.
US Economy
Last week the stock market’s impressive run led the S&P 500 within a whisper of its all-time high last seen on February 19. With the 50% rally from the March lows, equities are now up 4% year-to-date1. While the gains are certainly welcomed by investors, the rebound that has brought the market back near record levels features some interesting dynamics.
If the market officially eclipses February’s high, this will be the second-fastest bear-market recovery in the last half century, trailing only the rapid rebound in 1982. This reflects the unique economic shutdown and reopening aspects of this downturn, which produced the fastest-ever bear-market drop from a market peak, as well as what we expect to be an abnormally short official recession (though also abnormally severe).
The economy is still a long way from regaining its pre-pandemic GDP level, but the stock market’s recovery is a reflection of the forward-looking nature of the stock market. The rally is, analysts say, reflecting an outlook for a continued economic recovery and rebound in corporate profits over the remainder of this year and through 2021.
Metals and Mining
After hitting a new all-time high last week, gold retreated this session and is on track for a 4.2 percent decline. Despite the reversal, the yellow metal is still holding above US$1,940 per ounce. Recent headwinds for the yellow metal come courtesy of a variety of factors, including an uptick in US Treasuries paired with some renewed strength in the US dollar. Positive economic data out of America has also weighed on the broader precious metals sector; the country reported less than 1 million new jobless claims last week for the first time since the pandemic started. The base metals were also challenged over the five-day period, trending lower.
Despite mostly holding above US$1,900, gold recorded its poorest performance since March this week. The decrease ended the currency metal’s nine-week growth trend, but was expected by some. This week’s correction may be short-lived as the US government continues debating another round of stimulus measures, a factor that is likely to impact gold. Silver also pulled back this session, ending nine consecutive weeks of growth. Valued as both a precious and industrial commodity, the white metal was battered on two fronts as both sectors felt pressure. Slipping by 5 percent over five days, silver is still holding in the US$26 per ounce range, which is an important psychological threshold for the metal. Platinum hit its weekly high early on Monday and trended lower for the rest of the week. By Friday the price had shed 3.3 percent Continued demand challenges in the auto sector are preventing the metal from growing, but platinum has regained its March losses and is holding in the range it was at prior to pandemic closures. Palladium has faced similar headwinds as automotive demand is a primary end use of the metal. Prices also spiked early in the week, hitting US$2,167 per ounce. Market volatility set in a day later, sending the price to its weekly low of US$1,942. Since then prices have pulled back above US$2,000.
The base metals sector stalled this week, awaiting the next stimulus move from US Congress, plus the outcome of the US/China phase one trade deal review. Copper was one of the few commodities to squeak out a gain, climbing from US$6,363 per tonne on Monday to US$6,380 on Thursday. According to a Fastmarkets update, Chinese shipments of copper and aluminum have ballooned in recent weeks. That has prompted speculation that the country may be stockpiling ahead of another round of supply disruptions and scrap shortages. Zinc slipped lower this week but has still added 6 percent to its overall value in the last month. The industrial metal is now in range of its year-to-date high of US$2,466 per ounce, set on January 22. Nickel reached its year-to-date high on August 6, when it breached US$14,380 per tonne, taking out the previous high set in late January of US$14,285. Since achieving the milestone in early August, prices faced some pressure this week, impeding new growth. Lead was the only base metal to pull off a sizeable gain. Starting the week at US$1,880 per tonne, its price had climbed 2.7 percent by the week’s end. Despite the move, the lead price is still 4.6 percent off its year-to-date high of US$2,026 set on January 16. The price sat at US$1,932 on Friday.
Energy and Oil
Another week and another snoozer for oil prices. WTI and Brent remain in a narrow range, although their foothold in the $40s feels more solid than it has in the past. EIA data this week showed another decent stock decline, along with an uptick in gasoline demand. The International Energy Agency expects crude oil demand this year to be 8.1 million bpd lower than it was in 2019, a downward demand forecast revision of 140,000 bpd, the authority said in its latest Oil Market Report. The agency cited the very weak aviation industry as a main reason why demand could remain depressed. In the fourth quarter, oil inventories could draw down at “record speed,” according to SEB. “The IEA projected a call-on-OPEC in Q4 2020 of 29.5m bl/day. If this turns out to be correct and OPEC and OPEC+ both stick to their agreed caps, then global inventories will decline by between 4m bl/day and 5.2m bl/day in Q4 2020 – an inventory draw of between 370m bl and 480m barrels in a single quarter, which cannot be far from a historical record,” SEB’s Bjarne Schieldrop said in a statement. Natural gas spot price movements were mixed this week. The Henry Hub spot price fell from $2.18 per million British thermal units (MMBtu) last week to $2.06/MMBtu this week. At the New York Mercantile Exchange (Nymex), the price of the September 2020 contract decreased 4¢, from $2.191/MMBtu last week to $2.152/MMBtu this week. The price of the 12-month strip averaging September 2020 through August 2021 futures contracts remained the same week to week at $2.717/MMBtu.
World Markets
Equities in Europe ended the week higher on signs of progress in developing a vaccine against COVID 19, the disease caused by the coronavirus, and hopes that major economies could pursue additional stimulus measures to bolster a nascent recovery. The strong rally at the start of the week stalled on rising fears of a potential second wave of coronavirus infections in Europe, a risk that prompted the UK to impose more travel restrictions. In local currency terms, the pan-European STOXX Europe 600 Index ended the week 1.24% higher, Germany’s DAX Index rose 1.79%, France’s CAC-40 ticked up 1.50%, and Italy’s FTSE MIB gained 2.62%. The UK’s FTSE 100 Index climbed 0.96%.
Spikes in coronavirus infection rates sparked fears about a second wave in the pandemic. The BBC reported that Germany recorded its biggest daily increase in coronavirus cases in more than three months on Wednesday, while France suffered the biggest daily uptick in positive tests since lifting its lockdown restrictions in May. Spain has the worst infection rate in Europe, with 675 “active outbreaks.” The UK recorded the biggest rise in cases in seven weeks and added France, the Netherlands, and Malta to its quarantine list.
Mainland Chinese stock markets ended the week broadly unchanged as investors stayed on the sidelines ahead of U.S.-China trade talks on August 15. Many analysts see the talks—which are intended to review the progress of the phase one trade deal over the past six months—as a potential risk to markets, though President Trump is believed to want the deal upheld ahead of the November presidential election. However, U.S. import targets for 2020, to which China has committed, already appear out of reach.
In fixed income markets, the yield on China’s 10-year bond was broadly flat following mixed economic data, while the yuan ended largely unchanged against the U.S. dollar. China recently introduced several changes to improve its bond defaults mechanism, though more work needs to be done before domestic credit markets are on par with global standards, according to Asia Times Financial. The first Chinese bond default was in 2014, according to S&P Global Ratings, with 300 technical defaults by 110 companies since then. Just 100 have been resolved so far, mostly by in- and out-of-court restructuring, delayed payment, or liquidation. So far this year, domestic bond defaults have risen 6.6% from a year ago.
The Week Ahead
Economic data being released in the U.S. include building permits on Tuesday, the Federal Reserve’s July meeting minutes on Wednesday, and the leading index on Thursday.
Key Topics to Watch
- Empire state index
- NAHB home builders’ index
- Housing starts July
- Building permits
- FOMC minutes
- Initial jobless claims (regular state program, SA)
- Initial jobless claims (total, NSA)
- Continuing jobless claims (regular state program)
- Continuing jobless claims (total, NSA)
- Philly Fed index
- Leading economic indicators July
- Markit manufacturing PMI (flash)
- Markit services PMI (flash)
- Existing home sales
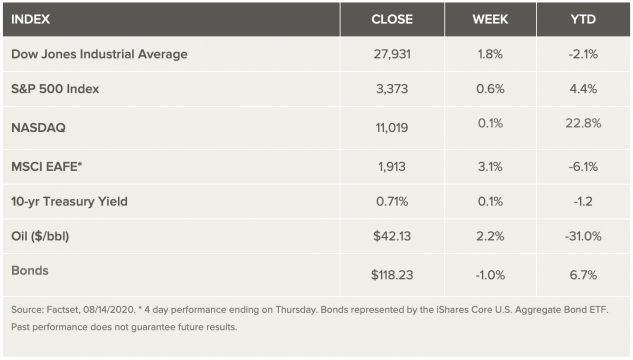
Markets Index Wrap Up