


s — here’s the average savings rate")
 Super Catch-Ups: Are They Right for You?")
 If You Have $500,000 in Your Retirement Account?")

 millionaires jumps 400%: Here’s what it takes to reach seven-figure status")


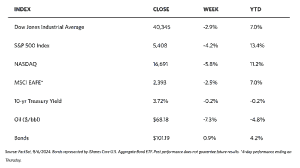
Stock Markets
Stocks corrected this week on the back of a disappointing labor market report. The 30-stock Dow Jones Industrial Average (DJIA) plummeted by 2.93% while the Total Stock Market Index plunged even deeper, by 4.38%. The broad S&P 500 Index came down by 4.25%, but the technology-heavy Nasdaq Stock Market Composite even underperformed the other major indexes by giving back 5.77%. The NYSE Composite slid by 3.26%. The risk perception indicator CBOE Volatility Index (VIX) shot up by 43.92%.
The S&P 500 experienced its deepest weekly drop in 18 months due to worries over an economic slowdown weighed on investors’ sentiment. Leading the declines were information technology shares, partly driven by NVIDIA following rumors that the firm might be the subject of an antitrust investigation by the Justice Department. September has historically been one of the worst months for stocks, averaging a monthly 0.7% drop since 1950. On the other hand, the S&P 500 has experienced declines of 4.9%, 9.3%, 4.8%, and 3,9% during September over the last four years. These suggest that investor nervousness over seasonal trading patterns may be a factor in the September declines. Trading volumes rose as investors returned to the market after the summer vacation and the long Labor Day weekend.
U.S. Economy
Economic news released during the week generally surprised on the downside and raised concerns that the Federal Reserve may have delayed too long before easing monetary policy. The Institute for Supply Management reported on Tuesday that its gauge for U.S. manufacturing activity remained in the contraction territory in August as new orders fell for the third straight month.
The report of July’s job openings by the Labor Department, which was released on Wednesday, further disappointed with the number of unfilled positions falling to 7.67 million, its lowest level since January 2021. Payroll processing firm ADP reported on Thursday that its count of private payrolls had increased only by 99,000 in August, the weakest since January 2021 and well below expectations. The U.S. economy created 142,000 jobs, falling short of the expected 164,000. July’s gain was revised down to 89,000, marking the lowest level since December 2020. Simultaneously, the unemployment rate fell to 4.2% from 4.3% while average hourly earnings rose by a better-than-expected 0.4%.
Friday’s jobs data appeared to sharply reduce expectations that the Fed would cut rates by a full 50 basis points. Nevertheless, a rate cut is still to be expected at the Fed’s upcoming policy meeting in September, leading many to expect a reduced 25-basis-point decrease.
Metals and Mining
Investors took profits this week as expectations for an aggressive easing of an aggressive rate easing were rolled back. Investors appear to accept that the Fed will cut rates by 25 basis points less than two weeks before the Federal Reserve’s monetary policy meeting. Expectations appear to firm up after data from the U.S. Bureau of Labor Statistics indicated that the labor market is cooling but not collapsing. Technical analysts have warned that the gold market appeared to be overextended above $2,550 per ounce as a 50-basis-point cut seemed unlikely. Furthermore, due to seasonal factors, September is one of the worst months for gold. Rather than any single event, gold investors need to focus on the path of rate cuts. The long-term rally is far from over. The economy is slowing and real interest rates will trend lower. This is an ideal environment for gold.
Gold ended this week at $2,497.41 per troy ounce, 0.24% lower than last week’s close of $2,503.39. Silver was last traded this week at $27.94 per troy ounce, 3.19% below the previous week’s closing price of $28.86. Platinum closed the week at $924.71 per troy ounce, 0.55% below its close last week at $929.79. Palladium was last traded at $916.05 per troy ounce, lower by 5.53% from the previous week’s closing price of $969.63. The three-month LME prices of industrial metals also went south. Copper, which ended last week at $9,235.00, last traded this week 1.55% lower, at $9,092.00 per metric ton. Aluminum, transacted last week at $2,447.00, fell by 2.80% to close this week at $2,378.50 per metric ton. Zinc, which closed last week at $2,897.00, lost this week by 5.51% to end at $2,737.50 per metric ton. Tin, priced last week at $32,346.00, last traded this week at $30,771.00 per metric ton for a 4.87% loss.
Energy and Oil
Typically, OPEC+ decisions which tend to impact highly on the market trigger reactions among investors. The same is not true about the group’s recent decision to postpone the return of barrels they have cut in 2023. Eight members of OPEC+ that were scheduled to unwind their 2.2 million barrels per day (b/d) of voluntary production cuts have agreed to delay their production hikes by two months, citing worse-than-assumed economic data from China and the United States. The lack of any reaction reinforces concerns that next year will see balances swinging heavily towards oversupply. Oil prices are set to close this week at their lowest level since June 2023 as ICE Brent hovers around $73 per barrel.
Natural Gas
For the report week beginning Wednesday, August 28, to Wednesday, September 4, 2024, the Henry Hub spot price rose by $0.17 from $1.89 million British thermal units (MMBtu) to $2.06/MMBtu. Regarding Henry Hub futures, the price of the October 2024 NYMEX contract increased by $0.048, from $2.097/MMBtu to $2.145/MMBtu this report week. The price of the 12-month strip averaging October 2024 through September 2025 futures contracts increased by $0.082 to $2.934/MMBtu. Natural gas spot prices rose at all major pricing locations this report week. The price increases ranged from $0.14 at the FGT Citygate to $3.57 at the Waha Hub.
International natural gas futures price changes were mixed for this week. Weekly average front-month futures prices for liquefied natural gas (LNG) cargoes in East Asia increased by $0.03 to a weekly average of $13.93/MMBtu. Natural gas futures for delivery at the Title Transfer Facility (TTF) in the Netherlands, the most liquid natural gas market in Europe, decreased by $0.04 to a weekly average of $12.28/MMBtu. In the week last year that corresponds with this report week (from August 30 to September 6, 2023), the prices were $13.26/MMBtu in East Asia and $10.75/MMBtu at the TTF.
World Markets
European stocks fell on renewed fears regarding the deteriorating outlook for global economic growth. This week, the pan-European STOXX Europe 600 Index closed 3.52% lower in local currency terms. Major stock indexes in the region also ended weaker. Italy’s FTSE MIB lost by 3.15%, Germany’s DAX lost by 3.20%, and France’s CAC 40 Index plunged by 3.65%. The UK’s FTSE 100 fell by 2.33%. UK and Eurozone government bond yields dropped across the board. As prospects appear mixed, the European Central Bank (ECB) potential rate cut rate cut is increasingly likely. ECB Governing Council member Gediminas Simkus said that he saw a “clear case” for a September interest rate cut, but that the potential for another rate cut in October was “quite unlikely.” Rate cuts could decrease in September but the policy should only ease gradually. Recent economic data so far confirms that inflation is slowing, enabling the ECB to lower borrowing costs without risking premature easing. Meanwhile, following an upward revision of June’s result to 4.6%, German manufacturing orders in July rose unexpectedly by 2.9% sequentially after seasonal and calendar adjustments. When large orders for transportation equipment were excluded, however, factory orders dropped by 0.4%.
Japan’s stocks succumbed to a sell-off for the week. The Nikkei 225 Index fell by 5.8% while the broader TOPIX Index lost by 4.2%. The market slumped halfway through the week due to semiconductor stocks tracking a U.S.-led sell-off, and the strength of the yen posed a headwind for Japan’s export-oriented companies. The yen strengthened from around JPY 145 the previous week to the JPY mid-142 range against the US dollar on expectations of narrowing Japan-U.S. interest rate differentials. The market anticipates that interest rates will be raised further this year by the Bank of Japan (BoJ), while the U.S. Federal Reserve is expected to cut interest rates in September. Demand for Japanese government bonds (JGB) grew as investors sought assets with lower risk. This is on the back of the perception that the U.S. economic data points to the possibility that the world’s largest economy is headed for a recession. The 10-year JGB yield dropped to 0.86% from 0.90% at the end of the previous week, despite data showing that Japan’s real wages (adjusted for inflation) grew by 0.4% year-on-year in July boosted by pay increases and summer bonuses. On the other hand, household spending rose only 0.1% year-on-year in July and remains sluggish despite solid income growth.
Chinese stocks pulled back due to weak corporate earnings and economic data. The Shanghai Composite Index declined 2.69% while the blue-chip CSI 300 gave up 2.71% for the week. The Hong Kong benchmark Hang Seng Index lost 3.03%. The National Bureau of Statistics reported that production and new order declines deepened, resulting in China’s official manufacturing purchasing managers’ index (PMI) slipping to a lower-than-expected 49.1 in August from 49.4 in July. The gauge holds below the 50-mark threshold that separates growth from contraction for all but three months since. The indicator for construction and services activity, the non-manufacturing PMI, exceeded expectations by inching up to 50.3 in August from 50.2 in July. The value of new home sales by the country’s top 100 developers fell by 26.8% year-on-year in August, picking up pace from a 19.7% drop in July, based on an assessment by the China Real Estate Information Corp. This continued drop in new home prices shows the waning impact of the government’s real estate rescue package in May, fueling further speculation that Beijing may announce further support measures to halt the property downturn. China’s housing clump, which is now in its fourth year, and rising trade tensions continue to weigh on China’s growth outlook, sending mixed signals to investors.
The Week Ahead
The CPI and PPI inflation data and consumer sentiment data are important economic releases scheduled for the week to come.
Key Topics to Watch
- Wholesale inventories for July
- Consumer credit for Aug.
- NFIB optimism index for Aug.
- Consumer price index for Aug.
- CPI year over year
- Core CPI for Aug.
- Core CPI year over year
- Initial jobless claims for Sept. 7
- Producer price index for Aug.
- Core PPI for Aug.
- PPI year over year
- Core PPI year over year
- Monthly U.S. federal budget for Aug.
- Import price index for Aug.
- Import price index minus fuel for Aug.
- Consumer sentiment (prelim) for Sept.
Markets Index Wrap-Up


 Super Catch-Ups: Are They Right for You?")
 If You Have $500,000 in Your Retirement Account?")


