


Millions of Americans are out of work due to the business closures resulting from the COVID-19 pandemic, but you wouldn’t know that from the S&P 500.
The broad-market index is on the vergeof putting in its first record closing high since Feb. 19, a period spanning 121 trading days, including Tuesday’s action.
The S&P 500 stands on Wednesday within 0.2% from its February record at 3,386.15, with a move above that level representing a stunning recovery after stocks plunged by nearly 34% to a recent bear-market low on March 23 at 2,237.40.
Since that March nadir, the S&P 500 SPX, +1.40% has gained 51%, while the Dow Jones Industrial Average DJIA, +1.04% —within 5% of its Feb. 12 record close—has advanced a little over 51% and the technology-laden Nasdaq Composite Index COMP, +2.12% has surged by about 60% and notched 32 closing records over the same period so far this year.
Much has been made about the stock market’s traverse from the lows to levels that are at or near records, while the economy, although improving, remains in tatters in the aftermath of the most severe public-health disaster in generations.
To be sure, the fact that equity indexes have come back from the coronavirus abyss doesn’t necessarily change the outlook for the economy or make the gains achieved thus far any more sustainable, but it is confirmation to some market experts that the trend has been consistently higher and could continue to be so amid optimism around potential vaccines, subtle improvements in parts of the business climate, better-than-feared corporate earnings and investors’ willingness to make bets on the future despite uncertainty.
“With the second wave of the virus coming under control, and jobs and spending continuing to recover faster than expected, corporate earnings have come in above expectations and appear on track to get back to pre-pandemic levels ahead of schedule,” wrote Brad McMillan, chief investment officer for Commonwealth Financial Network, in emailed comments.
Whatever the case, if the stock market notches a record close in the coming days, it will not just represent stocks coming full circle in the span of nearly six months but the official end to the bear market for investment purists who deem that a bear market, or fall from 20% from a recent peak, to be in force until an asset is able to achieve a fresh peak from out of its bear-market low.
Here’s how a tall of how we got from there to here.
About 63%
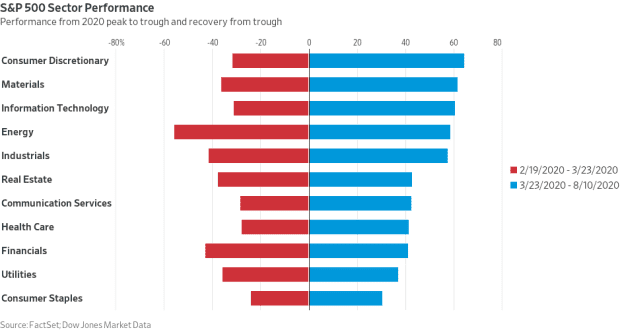
Consumer discretionary stocks, which include the likes of Amazon.com Inc. AMZN, +2.64%, were the best performers from the March low to now, according to Dow Jones Market Data. That segment of the S&P 500’s 11 sectors gained more than 63% since March, as of Monday. The benchmark’s materials sector, lead by gold-mining giant Newmont Corp. NEM, +0.19%, was the second-best performer, rising nearly 62%, while information technology, notably Nvidia Corp. NVDA, +5.44% and PayPal Holdings PYPL, +1.21%, returned just under 60% from the low, the data show (see attached chart).
The weighting of the technology sector is by far the largest in the S&P 500 and has grown to 27.61% from 24.78% at the end of 2019, led by megacap companies including Apple Inc. AAPL, +3.32%, Microsoft Corp. MSFT, +2.85% and Google parent Alphabet GOOGL, +1.80%. Other highfliers often mentioned in the same breath as tech companies include Facebook Inc. FB, and Netflix Inc. NFLX, communication services, and Amazon, consumer discretionary, but those companies aren’t tech stocks by S&P 500’s categorization
The consumer-discretionary sector, meanwhile, has climbed in weighting to 11.1% from 9.89%, while industrials have retreated to 8.07% from 8.89%.
Investors have pointed out that a recent pullback in the powerful upthrust for tech companies has given greater scope for other sectors of the market to rise, providing what investors have described as a necessary widening out of the market’s breadth.
“All it took for the S&P 500 to take out old the high was a broadening of the rally to include financials and energy,” said Jamie Cox, managing partner of Harris Financial Group. “We are there and that’s a good thing,” he said.
Under 310 days? Speedy recovery
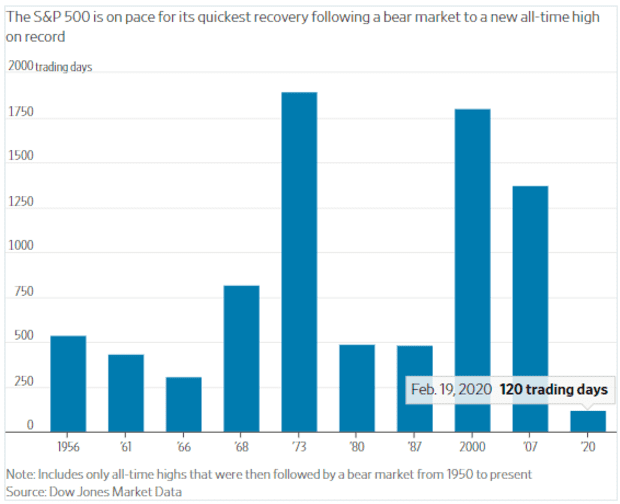
The S&P 500’s recovery is on the brink of being the fastest in history, 122 trading days including Wednesday, just as its decline from a record to bear market low was also the speediest such drop on record.
The current record for the S&P 500 from a bear market to a fresh record was the 310 trading days that the index traversed from its Feb. 9, 1966 low, to a record on May 4, 1967, Dow Jones Market Data show. It only took the S&P 500 16 trading days from its Feb. 19 peak to fall by at least 20%, meeting the textbook definition of a bear market.
The average recovery from a bear market takes 1,447 trading days.
On average, a bear market for the Dow lasts 206 trading days, while the average bear period for the S&P 500 is about 146 days, according to data from Dow Jones Market Data.


