


Is the stock market a bubble waiting to burst?
That is the question that some strategists and investors are considering as the U.S. equity market enjoys a run-up of at least 40% from the March lows, even as the economic picture, albeit an improving one, is currently looking unlikely to see a quick rebound from the COVID-19 pandemic.
A widening gap between stock valuations and economic fundamentals, with the S&P 500 index SPX, +0.16%, the Dow Jones Industrial Average DJIA, +0.59% and the Nasdaq Composite Index COMP, -0.80%, surging by at least 40% from their recent nadir, has led some to note that the divorce between economic reality and stock prices has all the hallmarks of a traditional asset bubble.
However, Nicholas Colas, Co-founder of DataTrek Research, says that one popular measure of implied volatility, the Cboe Volatility Index VIX, 3.26%, in the stock market can help gauge whether stocks are approaching bubblicious territory.
“The good news is that the VIX will tell us if we’re in another speculative bubble, because if that’s the hand we have to play we will see the Fear index stay mostly above 20,” Colas wrote in a Tuesday research note.
The index, which is known colloquially referred to by its ticker, VIX, has a long-run average around 20, hit an all-time high above 80 in March, a week before stocks hit a recent nadir on March 23, amid the worst of the outbreak of the novel strain of coronavirus that causes COVID-19.
The VIX, which typically jumps during big selloffs in the S&P 500, also tends to fall back during long, gradual rallies, Indeed, historically long periods of subdued volatility were a hallmark of the last years of the 11-year bull market that came crashing to an end with the coronavirus rout.
Colas notes that the average of all Cboe VIX closes back to its start in 1990 is 19.4. The VIX has traded above its historical average for 104 trading days, including Tuesday trade, according to Dow Jones Market Data, which represents the longest stretch above its average since the 117 trading days ending January 11, 2012.
Colas says that the VIX ‘s current level around 24 remains within 1 standard deviation from its norm, with 27.5 on the upper end of that range.
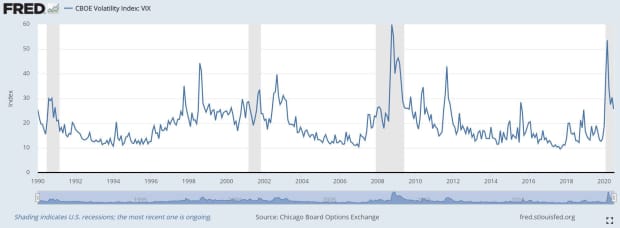
Colas says that tracking the VIX’s move during the dot-com bubble during the 1997-2000 period can be viewed as a moment in time analogous to this current state, with the VIX holding above its historical average back then while the market continued to drive higher.
“This was a relatively unusual period of market history, with higher than average VIX readings (reliably above 20) pairing up with stellar S&P 500 returns (1997 +33.1%, 1998 +28.3%, 1999 +20.9%),” The DataTrek analyst wrote.
The VIX, or fear gauge, as it is also known, has moderated in recent trade as large-cap stocks that have helped to propel the Nasdaq to fresh records, and the broader market as well, eased back somewhat last week.
Investors have been growing increasingly concerned that only a handful of stocks pushing the market up from its lows, including the likes of Facebook Inc. FB, -1.49%, Amazon.com AMZN, -1.83%, Apple Inc. AAPL, -1.38%, Netflix NFLX, -2.45%, Google parent Alphabet GOOGL, -0.50% GOOG, -0.46% and other names like Microsoft MSFT, -1.34% and Tesla TSLA, -4.54%, made the overall market more vulnerable to another shock as the economy tries to recover from the pandemic shock.


