


The markets are never fully democratic or egalitarian in their allocation of rewards and burdens. But the stock market is again in a phase where inequality issues among stocks, sectors and investment styles have become stark.
As in the broader society, this divide between haves and have-nots has triggered a debate about what it means for the long-term health of the market.
Even before the indexes staggered Friday, with the S&P 500 dropping 1.8 percent from a five-month high, the performance across the expanse of the market had been uneven, with select groups of stocks leading and many others wallowing.
The tape has shown a strong preference for very big companies over smaller ones, organic-growth vehicles over economically cyclical plays and groups offering a reliable stream of cash flow and income over all others.
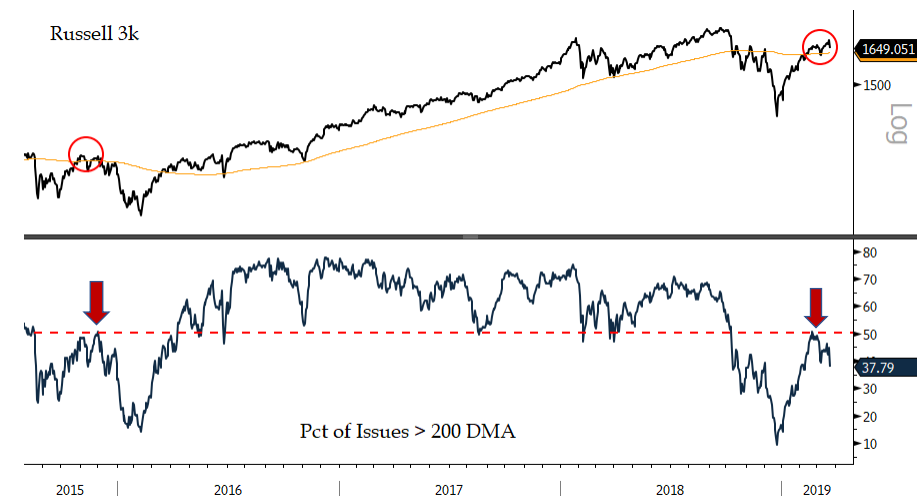
Starting with the broad numbers, only a minority of stocks are in an uptrend, trading above their 200-day average, even as the broad indexes themselves have spent most of the past two months above theirs.
Jonathan Krinsky of Bay Crest Partners shows fewer than 40 percent of the inclusive Russell 3000 index are above their 200-day mark.
This largely reflects the way small-cap stocks have rolled over in recent weeks, with new money congregating in the familiar giants of the Nasdaq. A one-month comparison of the Invesco Nasdaq 100 ETF (QQQ) and the small-cap Russell 2000 illustrates this split.

After leading the ferocious market bounce off the late-December bottom, value stocks and more cyclical names have given way to big growth names with less reliance on a pickup in economic activity.
Another way to view this: Stocks that act more like bonds are what investors prefer at the moment. Certainly this is behind the strong outperformance of the real estate and utilities sectors, which both hit fresh highs last week. Every S&P utility stock is above its 50-day average, as are 88 percent of real estate names and 78 percent of the consumer-staples sector.
But this is not just about dividend income holding appeal in a yield–scarce world. Big, dominant tech platforms and global branded-goods companies also get credit in the market’s unspoken logic as bond surrogates. Their cash flows are seen as durable and are expected to continue for many years to come.
This is why the FANG club and other popularly anointed growth stocks in its orbit do well when the market is clinging to “quality” and “defensive growth.” This also means the stocks that appear more expensive have been more in demand — making them more expensive. (Utilities, real estate, tech and staples — the strongest groups lately — are also the only ones with a premium valuation to the S&P 500.)
FANG (Facebook, Amazon, Netflix and Google parent Alphabet) plus Microsoft (now the largest stock in the market and very much grouped with FANG) make up 12.6 percent of the S&P 500 market value.
That’s about one-eighth of the index, comprised of five stocks. The blended price/earnings multiple on 2019 forecast profits of FANG-plus-Microsoft is 29.5. For the entire S&P 500, the P/E is 16.6. For the 495 S&P 500 names aside from FANG-plus-Microsoft, the multiple is 14.8.
This is not to suggest a dangerous level of concentration or overvaluation in the mega-cap tech group. The market in past decades has been far more top-heavy than it is now, with no immediate adverse consequences. And one could view the valuation gap is the market effectively rewarding the most resilient, financially formidable companies for their inherent advantages in a software-propelled economy undergoing constant disruption to traditional business models.
Its worth noting, there is another tier of nontech (or, those not labeled as tech) companies that fit into this privileged class. Nike and Starbucks have been nudging up to record highs in recent weeks, and both trade at fat 50 percent premium to the market. These are elite brands that travel well globally and don’t rely on every extra point of world GDP growth to succeed.
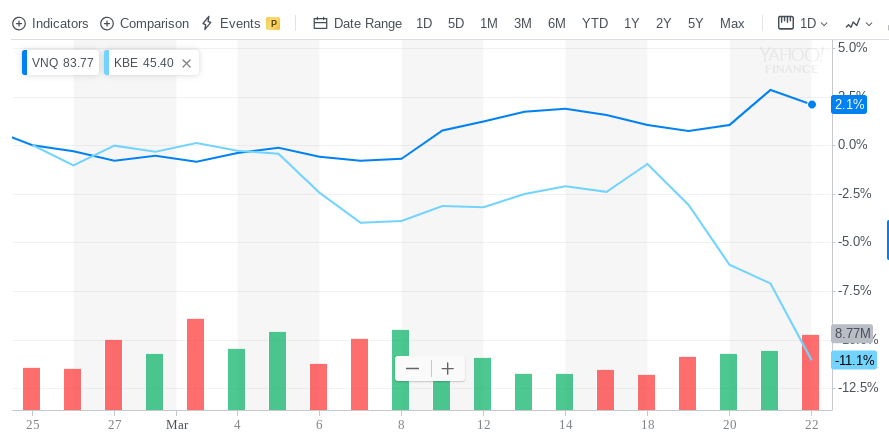
Left far behind by this market are financial stocks, with the S&P Bank ETF(KBE) reeling relative to the Vanguard Real Estate Index ETF (VNQ) — groups that were once members of the same S&P financial sector before real estate was split away.
Banks can be seen as anti-bonds and anti-brands: Their businesses and stocks suffer when bond yields are low and the spread among short and long maturities is pinched. They sell a commodity product (money) and disruptors stalk their traditional strongholds in payments, savings and lending.
But boy do they look cheap, with the largest banks under 10-times earnings and the entire S&P financial sector around 11.4-times — nearly two multiple points below their five-year average, according to FactSet.
With a buying frenzy in Treasurys last week and now extremely over-bullish sentiment toward bonds (based on daily trader sentiment polls), it would not be surprising to see yields back up in the short term, which no doubt would trigger a strong bounce in bank stocks.
But beyond a bounce it’s unclear whether the uneven, growth-besotted character of this market is poised to change. At a time when the global growth slowdown is back in vivid focus and investors rightly question whether the relief of the Federal Reserve’s patient pose has been “used up” through the post-December rally, the market huddling toward the perceived safety of growth stocks and bird-in-hand appeal of yield could remain the rule.
This type of action held the tape together for a while in the first half of 2016 — another year of global growth anxieties, an earnings recession and a sidelined Fed. Back then, earnings growth resumed and the expansion showed it had more life left. The bulls need to hope for something like a rerun playing out this year.


 shareholders have earned a 11% CAGR over the last three years")