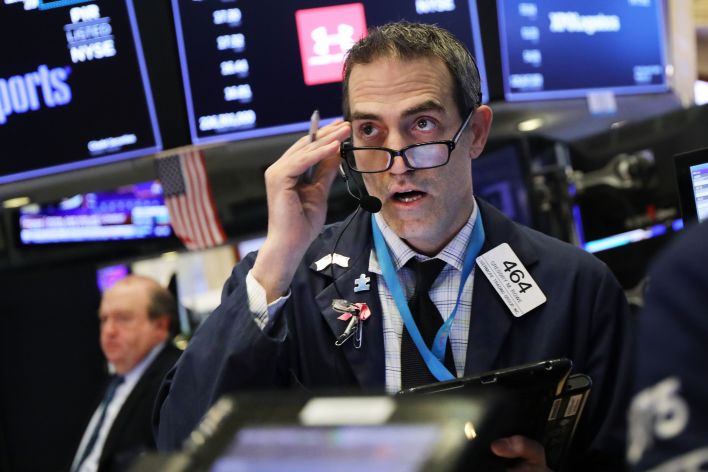
Stocks are extremely oversold, but investors still seem bent on selling after the Federal Reserve disappointed markets with a less dovish message than expected.
“The bears have been writing the script,” said Scott Redler, partner with T3Live.com.
The S&P 500 lost 1.5 percent Wednesday to 2,506 and is nearly 15 percent off its September high. About 85 percent of the S&P 500 stocks have seen a correction of 10 percent or more, while 60 are in a bear market, meaning down 20 percent.
“At this point the market is in no man’s land. It broke 2,600, and it broke 2,530, the February low, where we briefly bounced earlier this week. We closed below that today, and there’s nothing bullish about the tape except that we’re extremely oversold,” he said. “The only thing that’s positive is that there’s zero hope.”
Redler, who follows short-term technicals, said the market has been sending negative technical signals for weeks, starting with a death cross in the small cap Russell 2000 in late November.
Just last Friday the S&P 500 broke the neckline of a bearish head and shoulders top pattern, signaling more selling head.
Ari Wald, Oppenheimer technical strategist, said the negative action this week is the result of the market’s failure to find a bottom in October and November.
“This restarts the bottoming process. This was another boom, and now we need the whimper,” he said. Wald said as of Wednesday, just 17 percent of stocks in the S&P 500 were above their 200-day moving averages, close to levels from 2016 when there were as few as 12 percent.
Wald said that was an unusually low number. “The forward returns, when it gets that low, tend to be strong looking out six to 12 months but not necessarily over the next one to three months,” said Wald.
Redler said the best thing for the market would be a scary gap down for stocks Thursday because every morning this week , stocks opened higher and investors sold the early morning strength.
The next level is he is watching is 2,450 on the S&P 500, though the head and shoulders top pattern pointed to a possible decline to 2,300.
“You could get a rally first, but I put a very big high probability that we see 2,250 to 2,300 before you would want to put long-term money to work,” Redler said.
Wald said the market looks like it’s in for a period of selling. It’s very oversold, good for a longer term investor, but it doesn’t mean we’re setting up for an imminent recovery, ” he said.
Santa rally?
Wald said there’s a chance the so-called ‘Santa rally,’ could come between bouts of selling. It is typically the last five days of the old year and first three days of the new year, when the market is typically positive.
“You often do get strength in that seven day period, and if you don’t get it – if Santa shall fail to call, bears will come to Broad and Wall,” Wald said, sighting the old Wall Street adage.
He said the market is set up very much like 2014, when there were widening credit spreads coinciding with a steep drop in crude. He said the energy sector is breaking down.
“That is a key area dragging on markets here,” he said. “If you’re looking to sniff out opportunity, look in the software space.” He added that Microsoft is still above its 200-day moving average.
“It really is indiscriminate selling, of high and low momentum stocks. Nobody cares about relative strength in a falling market,” he said. “The speed of the decline is definitely surprising us more than the actual declien. We’ve been playing by this road map that this is a cyclical bear market in a secular bul lmarket. The average decline is 20 percent. We’re down about 15 percent.”
Redler also said the decline wasn’t unexpected.
“It’s happening because we’re 10 years into a bull tape that was longer than it should have been, and now they’re removing accommodation that was probably there longer than it should have been. This is a normal part of the cycle,” said Redler.


