Stock Markets
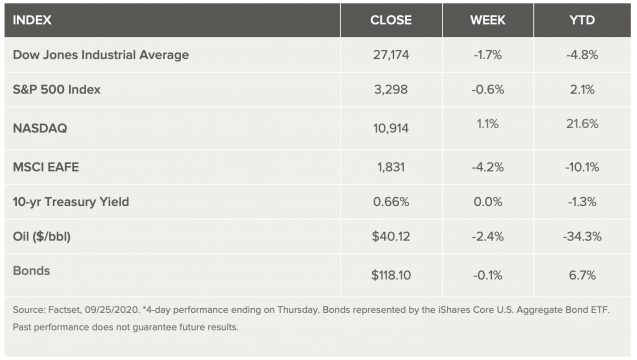
Stocks fell last week, marking the longest weekly slide since 2019, as investors continue to digest news that U.S./China trade tensions are rising, a coronavirus vaccine won’t be widely available until April of 2021, jobs data came out worse than expected, and expectations are fading that a new fiscal stimulus package will be passed. Mega-cap stocks outperformed the S&P 500 last week, but Microsoft, Apple, Netflix, Amazon and Facebook are all still down for the month. Small-cap and cyclical stocks were hardest hit by the news that a vaccine is further away than initially thought. Ruth Bader Ginsburg’s death has ushered in fears that stimulus talks between Republicans and Democrats could be overshadowed by a political battle for a Supreme Court nominee. A surge in coronavirus cases in Europe has also seen investors shun some European stocks on fears that economic restrictions could be reestablished.
US Economy
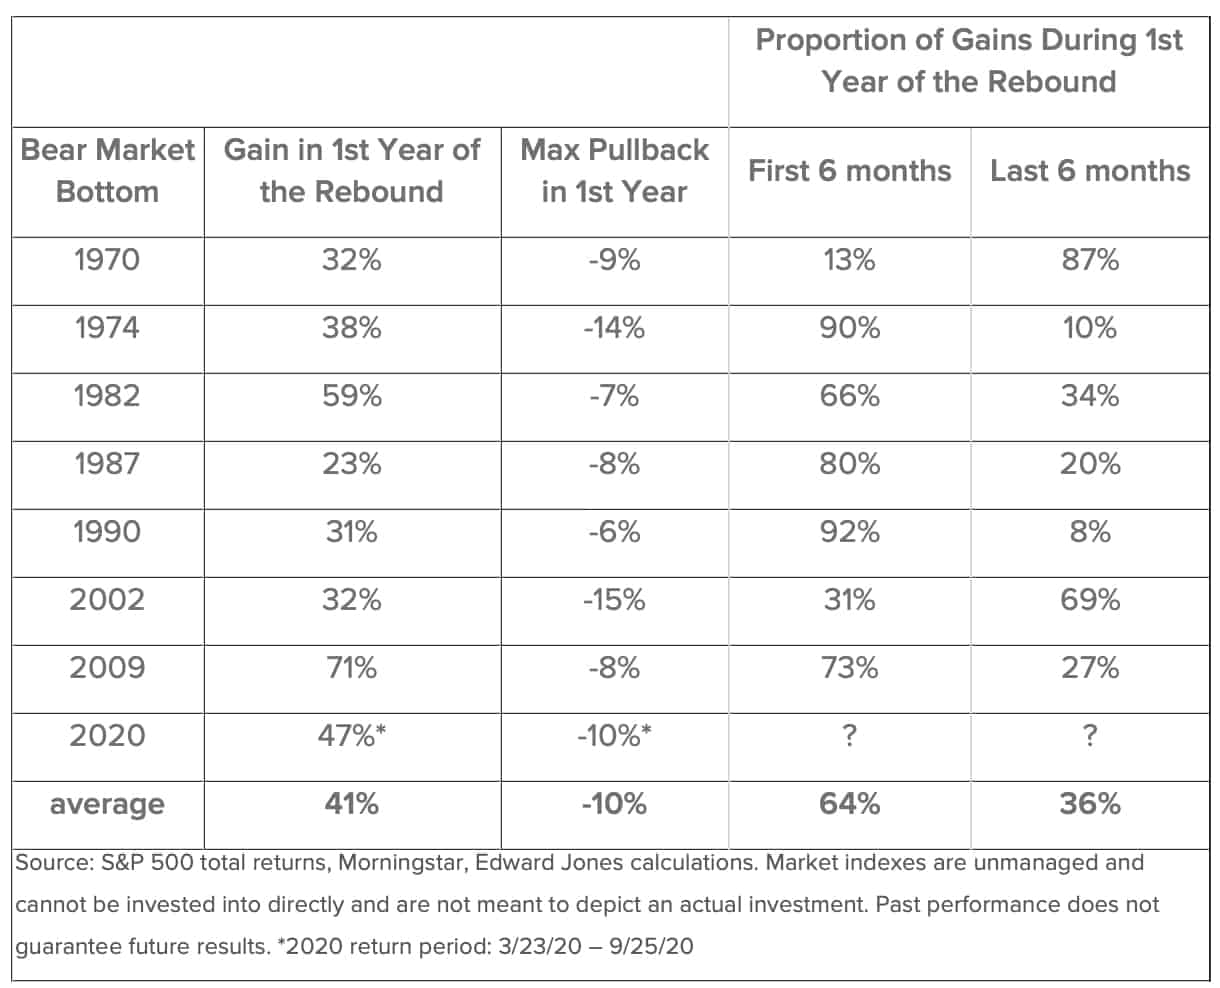
Analysts believe the newly emerging bull market will prove durable, but not without growth scares and setbacks, as the range of economic outcomes remains wide (though narrower than in the spring). Following a powerful six-month rally, returns will likely slow, but the gains are not necessarily exhausted, and a correction could prove healthy. While today’s environment is unique, it is helpful to gauge the range of historical outcomes during past early recoveries. The table below provides a historical view of the S&P 500’s performance during the first year of the rebound following bear markets and offers the following takeaways:
Corrections are common, as conditions coming out of recessions are typically wobbly.
Looking at the distribution of market gains, the bulk of gains were mostly captured in the first six months of the first year of the rebound but returns continued to be above average in the second half, even as the pace of gains slowed.

At this juncture, analysts are recommending investors stay balanced and diversified but also opportunistic, deploying available cash towards long-term goals, if appropriate. As the correction plays out, lagging asset classes and sectors (including defensive areas like utilities, staples and health care) can present rebalancing opportunities to fill gaps in underrepresented areas within portfolios.
Metals and Mining
The gold price slumped this week, dipping below US$1,900 per ounce for the first time in eight weeks. It shed as much as 3.1 percent, largely due to a rebounding US dollar. The American greenback is on track for its best performance since April, and that has weighed on the yellow metal’s safe haven appeal. The strong US currency is also dragging on the precious metals as a whole, and all of them were in the red on Friday morning. The base metals did not fare any better, with that sector experiencing a marked decline as well. Gold has sat flat for most of September but spent the last full week of the month trending lower, even dropping as low as US$1,850 midway through the period. Analysts have attributed the decline to risk-aversion sentiment working against the yellow metal. The price drop led to some dip buying, helping the metal hold above US$1,850 on Friday. The silver price began falling early on Monday and has faced little resistance in its decline. Opening the session at US$26.02 per ounce, a 15 percent drop brought the white metal down as far as US$21.89, its lowest point since mid-July. Like its sister metal gold, silver spent the latter half of August and the early September trading flatly. Locked at the US$27 level, the metal made its sharpest decline this week. Silver later saw a small uptick to the US$23 range, and on Friday it was at US$22.93. After slowly edging higher throughout September, platinum was challenged during the last full session of the month. The pressure prompted the metal to slip below US$900 per ounce. Despite the recent value drop, the World Platinum Investment Council (WPIC) still anticipates investor interest in the metal. The palladium price also lost some recent gains when the metal pulled back from its three-week high of US$2,251 per ounce early on Monday. Although the other precious metals benefited from dip buying, palladium was unable to gain momentum on Thursday, and fell to the lowest point for the week on Friday morning. That day, palladium was moving for US$2,091.
Copper prices sank this week as reality began to set in on the markets. It fell 4.3 percent from its Monday value of US$6,837 per tonne on the back of a volatile broad-based selloff in US equities. By week’s end, copper was holding at US$6,538.50 as buying pressure began to re-emerge. Headwinds also pushed nickel lower. But despite its late September selloff, the metal was able to hold above US$14,000 per tonne, ending the session at US$14,179. Zinc also ended the week 4 percent lower, dragged down by a slump in demand. Despite the widespread slip, analysts are expecting the inflationary tone set across economies globally to translate to higher prices for all commodities. On Friday, zinc was priced at US$2,379.50 per tonne. Lead experienced the most modest decline this period, falling from US$1,871.50 per tonne to US$1,856 by Friday. However, lead has been on a downtrend for most of September. After approaching year-to-date high territory early in the month at US$1,984, prices continuously fell and hit US$1,856 this week.
Energy and Oil
Oil prices continue to exhibit a familiar trading pattern, bouncing around in a narrow range. EIA data was bullish last week, showing inventory declines. But that optimism has been offset by concerns about the coronavirus and new restrictions in Europe. Still reeling from historic wildfires, California Governor Gavin Newsom is seeking to end the internal-combustion engine. Governor Newsom ordered state regulators to come up with rules to phase out the sale of new gasoline or diesel vehicles by 2035. The move will have a dramatic impact on in-state refiners and oil producers, but because California consumes nearly 1 mb/d of oil, the impact will be felt globally. However, successful implementation is uncertain as it relates to ongoing legal battles, the makeup of the Supreme Court and the outcome of the presidential election. The UK is aiming to bring forward its ban on gasoline and diesel vehicles from 2040 to 2030. Prime Minister Boris Johnson is expected to roll out the announcement this autumn in an effort to accelerate the transition to electric vehicles. Three out of four oil executives surveyed by the Dallas Federal Reserve believe that U.S. oil production has already hit a peak. The Fed survey also shows business activity rebounding a bit from a low point in the second quarter, but nearly half of the respondents said that WTI would need to rise to $51-$55 for drilling activity to accelerate. Another third said WTI would need to increase to $56-$60, while 15 percent of respondents said it would require WTI above $60. The EIA reported a crude stock draw of 1.6 million barrels for the week ending on September 18. Notably, distillate stocks also declined, falling by 3.4 million barrels. A glut of diesel had become a particular concern in recent weeks, so the drawdown was positive news for oil markets.
Natural gas spot price movements are mixed this week. The Henry Hub spot price fell from $2.06 per million British thermal units last week to $1.74/MMBtu this week. At the New York Mercantile Exchange (Nymex), the price of the October 2020 contract decreased 14¢, from $2.267/MMBtu last week to $2.125/MMBtu this week. The price of the 12-month strip averaging October 2020 through September 2021 futures contracts climbed 3¢/MMBtu to $2.911/MMBtu. The net injections to working gas totaled 66 billion cubic feet (Bcf) for the week ending September 18. Working natural gas stocks totaled 3,680 Bcf, which is 16% more than the year-ago level and 12% more than the five-year (2015–19) average for this week.
World Markets
Shares in Europe tumbled as a surge in coronavirus infections prompted some countries to implement stricter containment measures. Signs that the economic recovery may be stalling also weighed on stocks. In local currency terms, the pan-European STOXX Europe 600 Index ended the week 3.60% lower, while Germany’s DAX Index dropped 4.93%, France’s CAC 40 fell 4.99%, and Italy’s FTSE MIB slid 4.23%. The UK’s FTSE 100 Index lost 2.74%.
IHS Markit’s composite purchasing managers’ index (PMI) showed that the recovery in eurozone business activity lost steam in September as rising coronavirus infection rates and social distancing weakened demand in the services sector. An early estimate of the September PMI came in at 50.1, down from 50.9 in August. (A PMI reading of 50 marks the level between expansion and contraction.) The services portion of the index slipped below 50, hitting a four-month low. The manufacturing index, however, reached a 31-month high on stronger exports.
Stocks in China fell in tandem with the global correction, with the benchmark Shanghai Composite Index and CSI 300 Index dropping 3.6% and 3.5%, respectively, in their biggest weekly loss since mid-July. In fixed income markets, the yield on China’s sovereign 10-year bond shed three basis points to 3.13%. China’s central bank left its loan prime rate, the reference rate for new bank loans, on hold for the fifth straight month, as expected. The yuan weakened to CNY 6.82 per U.S. dollar in a risk-off week characterized by broad dollar strength.
The Week Ahead
Important weekly economic data coming out next week includes personal consumption, the unemployment rate, and the Consumer Confidence Index.
Key Topics to Watch
- Advance trade in goods
- Case-Shiller national home price index (year-over-year change)
- Consumer confidence index
- ADP employment report
- GDP revision (SAAR)
- Chicago PMI
- Pending home sales index
- Initial jobless claims (regular state program, SA)
- Initial jobless claims) (total, NSA)
- Continuing jobless claims (regular state program)
- Continuing jobless claims (total, NSA)
- Personal income
- Consumer spending
- Core inflation
- Markit manufacturing index
- ISM manufacturing index
- Construction spending
- Varies Motor vehicle sales (SAAR)
- Nonfarm payrolls
- Unemployment rate
- Average hourly earnings
- Consumer sentiment index
- Factory orders Aug.
Market Summary


