


 Forecast for 2025 Was Just Updated, and It May Surprise Retirees")

Spotting a stock-market bubble isn’t as easy as it sounds. And even when traders do correctly identify one, economist John Maynard Keynes’s famous warning that the market can remain irrational “longer than you can remain solvent” should still ring in their ears, says Julian Emanuel, chief equity and derivatives strategist at BTIG.
But it’s no surprise, with a tech-concentrated stock rally grinding ever higher, pushing the S&P 500 SPX, +0.27% less than 1% away from its Feb. 19 closing peak, investment-grade credit spreads tightening and gold soaring that investors are seeing a number of potential bubbles, he said, in a Sunday note.
And after all, what Emanuel labels the “Nasdaq 5” are really driving the market right now. Facebook Inc. FB, -2.02% is up 30% year to date; Amazon.com Inc. AMZN, -0.60%, up 71%; Apple Inc. AAPL, +1.45%, up 51%; Microsoft MSFT, -1.99%, up 35%; and Google parent Alphabet Inc. GOOGL, -0.10% GOOG, +0.10% up 12%.
“Investors, whether overweight or underweight the NASDAQ 5, are becoming uncomfortable. Visions of Bitcoin in 2017, houses in 2006 and tech in 2000 arise,” Emanuel wrote.
But that doesn’t make for a bubble, at least not when it comes to valuation, he said, noting that the S&P 500 trading at 25.8 times 12-month trailing earnings, while elevated, still isn’t comparable to the near 30 times earnings of the dot-com era — espeically given that the 10-year Treasury yield is now below 0.6% versus the 6% level seen at the turn of the century.
From a market concentration standpoint, things look more bubbly, he acknowledged. The top 5 Nasdaq stocks now account for 23% of the S&P 500’s weighting, he noted. But the fact that it has far surpassed the 18% peak for the 2000 top five only underlines what’s been the “Keynesian futility” of positioning against the top five, Emanuel said.
There might be an opportunity forming, he said, when it comes to the “dispersion,” or the gap, between the S&P 500’s top- and bottom-performing sectors (see chart below).
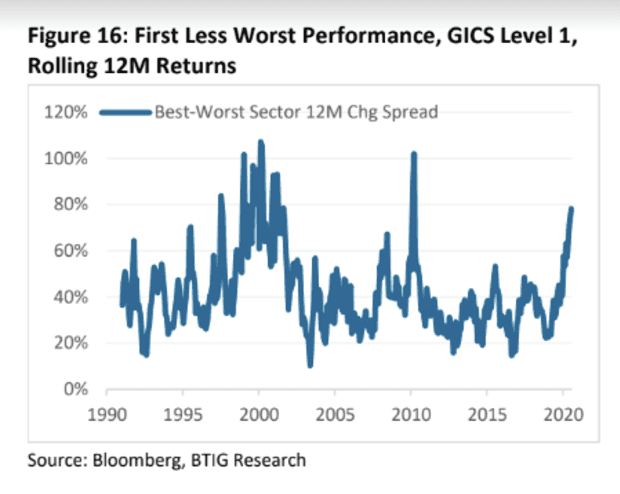
Through July 31, the tech sector had outperformed the energy sector by 78.2%, Emanual noted. Thirty years of data on the rolling 12-month performance of best and worst sectors shows “skew toward forward outperformance of energy, financials, and health care once the top decile of dispersion begins,” he wrote. The top decile begins when the top sector outperforms the bottom sector by at least 65.2%.
Tech, communication services and materials, sectors showing extreme momentum, boosted by a weak dollar which could stabilize in the days ahead, tend to lag across most forward time frames, he said.
Tech stocks on Monday were taking a breather, with the Nasdaq Composite COMP, -0.38% down around 0.5%, while the beaten-down energy and industrials sectors were leading the S&P 500. The Dow Jones Industrial Average DJIA, +1.30% was up nearly 350 points, or 1.3%, in late afternoon trade.
Emanuel said there were a number of options plays that could capture the potential shift.
Meanwhile, the question remains what could eventually be the trigger.
Emanuel writes:
Will the catalyst for Sector performance reversion in 2020-21 be a vaccine, favoring cyclicals over [work from home] as the economy reopens? Or will it be higher interest rates, generally positive for Financials and traditionally a headwind for high multiple names. Or perhaps it will be further escalation of China tension into Election 2020 , a negative for China exporters – Tech; favoring domestic industries like Health Care? Or will there be no catalyst, as bubbles tend to be identified in hindsight, as it was in Y2K?


