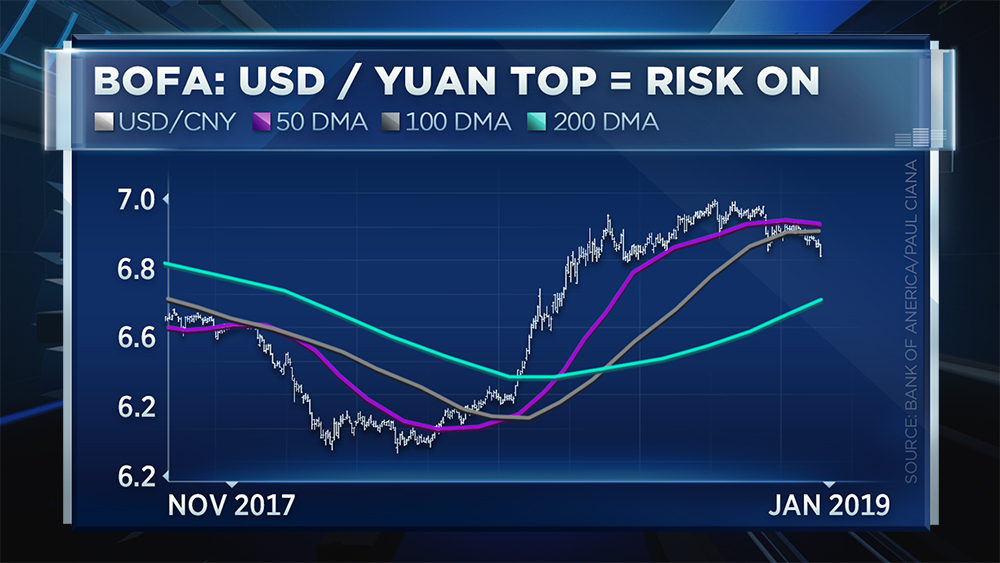
Bank of America-Merrill Lynch sees evidence the stock market’s bullish activity has near-term staying power.
And, it’s using a currency chart to illustrate its case.
Paul Ciana, the firm’s chief global technical strategist, highlighted the dollar versus the Chinese yuan on CNBC’s ”“Futures Now ” to show the strength of “risk on” (or high-yielding, risk-sensitive) assets.
His big takeaway: The broader market rally has room to run because the dollar/yuan currency pair is in a downtrend.
“We have a technical top in the U.S. dollar versus the Chinese yuan. Now, that’s a very important technical top to have because it means the dollar is weakening,” he said Thursday. “The lower that the exchange rate between the U.S. dollar and the Chinese Yuan comes down, the more it is a sign, per say, that the trade agreements between the U.S. and China are going well.”
The dollar versus the yuan has been trading at its weakest level since July.
“We have a nice left shoulder, head and right shoulder that formed. That neckline was broken just the other day right in here. We’re now legging down not to one, but to a second new low,” said Ciana.The “risk on” rally’s stamina
He noted the chart can also indicate when the rally may run out of steam. Ciana said it’s one of the most common concerns he’s getting from clients.
According to Ciana, the chief level to watch on his chart is 6.70 because that’s when oil, treasury yields and stocks could potentially reverse at their key technical levels and resume their bearish December trend.
But for now, Ciana is in the “risk on” rally camp until there are signals that suggest the dollar/yuan is rising.
